Your route network, visualized
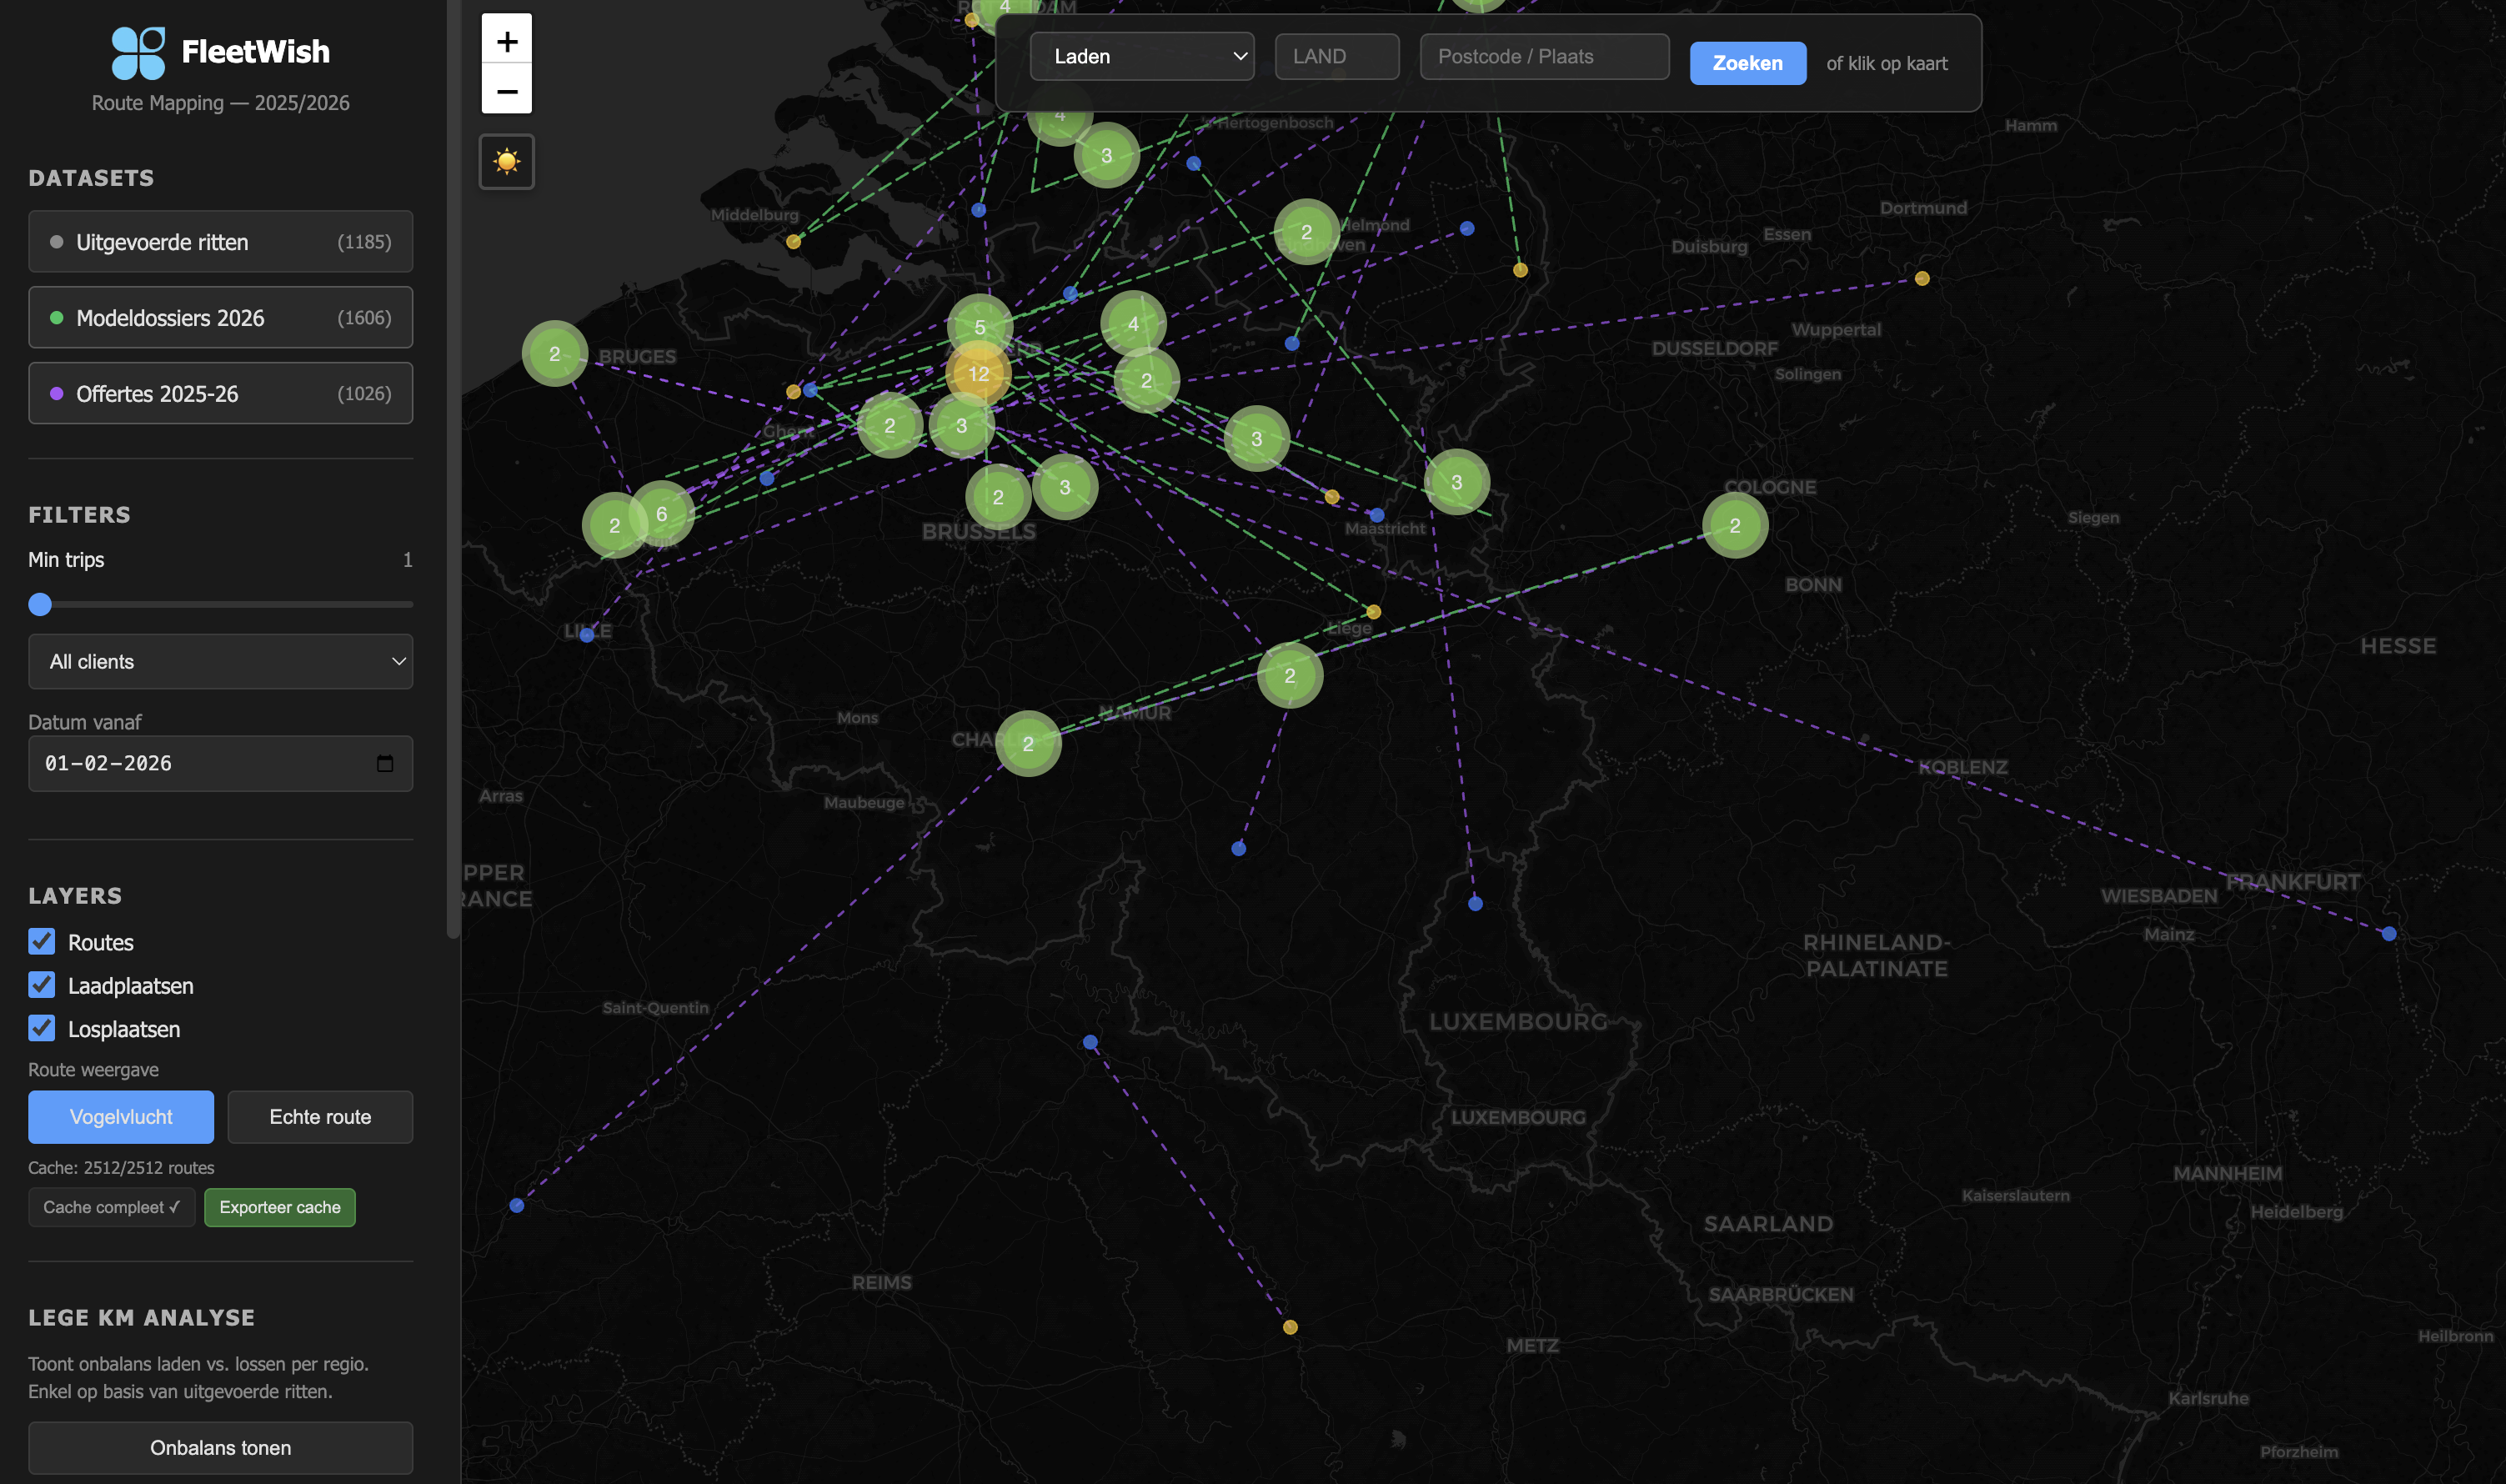
Hundreds of routes across Europe. Dozens of clients. Years of historical data. FleetWish puts it all on one map.
Route data trapped in spreadsheets
Planners manage route info across TMS exports, Excel files, and email threads. No single view of the full network.
When a new request comes in, they rely on memory and manual searches. Coverage gaps go unnoticed. Historical patterns remain invisible.
The result: missed opportunities for expansion, slow decision-making, and incomplete network visibility.
One map. Every route. Every client.
Upload your TMS data or Excel exports to FleetWish. Filter by client, date, region. See route density, corridors, and patterns instantly.
Our heatmap algorithm reveals regional concentration. Spot opportunities for expansion or consolidation. Identify underserved areas.
Full Network Overview
Every route on one map. See your entire transport network at a glance.
Filter & Segment
Slice data by client, corridor, vehicle type. Analyze segments separately.
Pattern Recognition
Heatmaps reveal which corridors matter. Find the gaps. Spot the gold.
How it works
Import
Upload your route data from TMS, Excel, or logistics platform. No complex integrations needed.
Explore
Visualize all routes on an interactive map. Filter by client, date, region, or vehicle.
Optimize
Analyze patterns. Identify opportunities. Plan your next move with full visibility.